greatpy vs Great
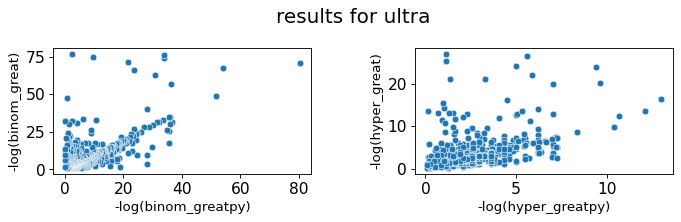
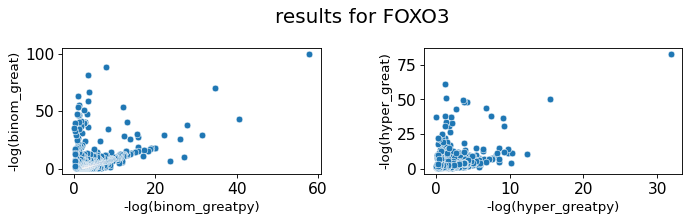
For each file, the function returns a scatterplot allowing the comparison between the binomial and hypergeometric p-value of greatpy vs GREAT, the Pearson coefficient for each of these representations.
[1]:
%load_ext autoreload
%autoreload 2
[2]:
import greatpy as great
import pandas as pd
from math import inf
from numpy import log,nan, int64,cov,corrcoef
from scipy.stats import pearsonr
import os
import re

import warnings
warnings.filterwarnings('ignore')

import time
Compute the results from multiple files.
[56]:
t = []

for path in os.listdir("../data/tests/test_data/input/"):
    sp = path.split(".")
    id = sp[0][:2]
    name = sp[0][3:]
    great_out = ""
    great_asso = ""

    for out_path in os.listdir("../data/tests/test_data/output/"):
        if out_path.split("_")[0] == id:
            if re.match(".*hg19.*", out_path) != None: assembly = "hg19"
            else: assembly = "hg38"
            if re.match(".*output.*", out_path) != None: great_out = "../data/tests/test_data/output/" + out_path
            else: great_asso = "../data/tests/test_data/output/" + out_path
    if assembly == "hg38" :
        t.append("../data/tests/test_data/input/" + path)
        regdom = f"../data/human/{assembly}/regulatory_domain.bed"
        size = f"../data/human/{assembly}/chr_size.bed"
[ ]:
results = great.tl.enrichment_multiple(
    tests = t,
    regdom_file=regdom,
    chr_size_file=size,
    annotation_file="../data/human/ontologies.csv",
    annpath=None,
    binom=True,
    hypergeom=True
)
Make the plots
[55]:
pp,asso,stat = great.pl.get_all_comparison(results)


Great vs greatpy correlation
[58]:
pd.options.display.float_format = '{:.2f}'.format
[47]:
stat
[47]:
| name | pearson_binom | pearson_hypergeom | |
|---|---|---|---|
| 0 | ERF | 0.58 | 0.61 |
| 1 | MAX | 0.60 | 0.67 |
| 2 | random | 0.24 | 0.12 |
| 3 | ultra | 0.53 | 0.68 |
| 4 | srf | 0.63 | 0.60 |
| 5 | FOXO3 | 0.44 | 0.55 |
| 6 | height | 0.49 | 0.63 |
The correlation is not very good because we could not use the same ontology file as Great
The one we use is from a 2022 release while GREAT uses a 2012 file