greatpy


Implementation of GREAT in Python
Installation
You need to have Python 3.8 or newer installed on your system. If you don’t have
Python installed, we recommend installing Miniconda <https://docs.conda.io/en/latest/miniconda.html>_.
There are several alternative options to install greatpy:
Install the latest development version:
pip install git+https://github.com/theislab/greatpy.git@main
Notebook
Information |
link |
|---|---|
Create regdom |
|
enrichment |
|
plot |
|
Comparaison with GREAT |
Getting started
Please refer to the documentation. In particular, the
What is GREAT :
GREAT (Genomic Regions Enrichment of Annotations Tool) is a bioinformatics tool, this method enables to associate genetic regions to the most probable GO terms.
What can you do with greatpy :
This package is strongly inspired by GREAT allowing Helmholtz to have a stable, perennial and updated version of the package.
GREAT figure issue from GREAT article
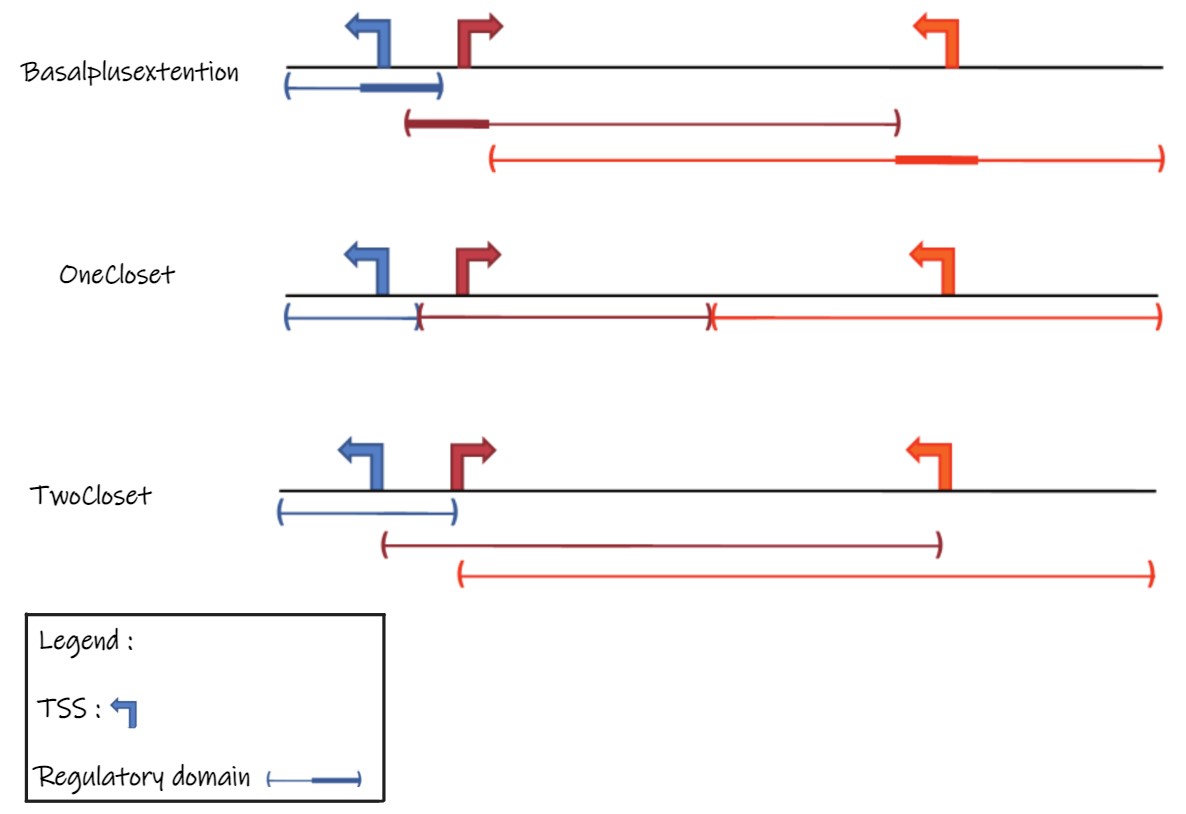
1. Create regulatory domain from tss
Translate a genetic file in
.bedformat and containing the following information:TSS file should have the following columns :
chromosome_number \t position \t strand \t gene_name.Chromosome size file should have the following columns :
chromosome_number \t chromosome_size.
regdom = greatpy.tl.create_regdom(
    tss_file=Input_TSS_path,  # eg : "../data/human/hg38/tss.bed"
    chr_sizes_file=Input_chromosome_size_path,  # eg : "../data/human/hg38/chr_size.bed"
    association_rule="Basalplusextention",
    out_path=path_save_output,
)
The association rules parameters could be :
BasalplusextentionOneClosetTwoCloset
2. Get enrichment of GO term in the tests genomics regions
Analyzes the significance of proximal and distal cis-regulatory regions in the genome.
Some files should be used as input :
test file should have the following columns :
chr \t chr_start \t chr_end.regulatory domain file should have the following columns :
chr \t chr_start \t chr_end \t name \t tss strandchromosome size file should have the following columns :
chromosome_number \t chromosome_size.annotation file should have the following columns :
ensembl \t id \t name \t ontology.group \t gene.name \t symbol
res = greatpy.tl.enrichment(
    test_file=Input_path_or_df,  # eg : "../data/tests/test_data/input/10_MAX.bed"
    regdom_file=regdom_path_or_df,  # eg : "../data/human/hg38/regdom.bed"
    chr_size_file=chromosome_size_path_or_df,  # eg : "../data/human/hg38/chr_size.bed"
    annotation_file=annotation_path_or_df,  # eg : "../data/human/ontologies.csv"
)
Several arguments can be added to this function such as :
binom(default True): should the binomial p-value be calculated?hypergeom(default True): should the hypergeometric p-value be computed?
It is then possible to apply a Bonferroni and/or FDR correction to the found p-values:
res = great.tl.set_fdr(res)
res = great.tl.set_bonferroni(res)
3. Plot
1 genomic distribution of data
Number of genetic associations per genomic region
Distance to the associated gene TSS for each genomic region studied
Absolute distance to the associated gene TSS for each genomic region studied
fig, ax = plt.subplots(1, 3, figsize=(30, 8))
greatpy.pl.graph_nb_asso_per_peaks(
    Input_path_or_df,  # eg : "../data/tests/test_data/input/10_MAX.bed"
    regdom_path_or_df,  # eg : "../data/human/hg38/regdom.bed"
    ax[0],
)
greatpy.pl.graph_dist_tss(
    Input_path_or_df,  # eg : "../data/tests/test_data/input/10_MAX.bed"
    regdom_path_or_df,  # eg : "../data/human/hg38/regdom.bed"
    ax[0],
)
greatpy.pl.graph_absolute_dist_tss(
    Input_path_or_df,  # eg : "../data/tests/test_data/input/10_MAX.bed"
    regdom_path_or_df,  # eg : "../data/human/hg38/regdom.bed"
    ax[0],
)
plt.show()

2 Enrichments by GO terms (dotplot) - one input
plot = enrichment_df.rename(columns={"binom_p_value": "p_value", "go_term": "name"})
plt.figure(figsize=(10, 10))
great.pl.plot_enrich(plot)

3 Enrichments by GO terms (dotplot) - multiple inputs
test = ["name_bindome_biosample_1", "name_bindome_biosample_2", "..."]
tmp_df = great.tl.enrichment_multiple(
    tests=test,
    regdom_file="../data/human/hg38/regulatory_domain.bed",
    chr_size_file="../data/human/hg38/chr_size.bed",
    annotation_file="../data/human/ontologies.csv",
    binom=True,
    hypergeom=True,
)

Note
Both types of tests (binomial and hypergeometric) performed may be susceptible to certain biases of which one must be aware to analyze the results with a critical mind.
The hypergeometric test may be biased by the size of the regulatory domains of the genes since isolated genes have very large regulatory domains and are therefore more likely to generate false positives.
The binomial test can also be biased if a large number of genomic regions to be tested are associated with a small set of genes that can also generate false positives.
But these biases are partially compensated between each of the tests the binomial test reduces the hypergeometric bias by taking into account exactly the size of the regulatory domains of the genes and the hypergeometric test compensates for the bias of the binomial test by counting each gene only once. The two types of tests are complementary and must be analyzed together to conclude.
Release notes
See the changelog.
Contact
For questions and help requests, you can reach out in the scverse discourse. If you found a bug, please use the issue tracker.
Citation
For cite greatpy:
@software{greatpy,
  author = {Ibarra, Mauger-Birocheau}},
  doi = {},
  month = {},
  title = {{greatpy}},
  url = {https://github.com/theislab/greatpy},
  year = {2022}
}
References
References aviable in the references page.